Do you have a slow internet? Need to visualize your internet speed over time? Do you want to know when outages are happening?
I've had terrible problems with the performance of my internet connection. I started this little project because I found myself going into Fast.com a lot to check what the internet speed was in the moment.
Eventually I wrote some code to record and visualize internet performance over time. This automatically tests and records my internet speed. The data is stored in a CSV file so you can load it in Excel afterward for manipulation and graphing. For convenience I added a web page that visualizes the data in a chart.
Contents
generated with DocToc
- Contents
- Getting the code
- Why?
- Screenshot
- Manually measuring internet speed
- Gathering the data via JavaScript
- Recording the data
- Scheduled recording
- Fixing issues with Fast-cli
- Exposing the data with a REST API
- Graphing the data with Flot
- Conclusion
- Resources
Getting the code
Working example code for this post is available to Patrons.
Please show your support on Patreon and I'll give you access to the code and help you get it running. The code runs on Node.js and it is easy to run.
I also have a desktop build prepared for Patrons. There is no setup required for this, just download it and run it to start your automated internet speed testing.
UPDATE 2019
I'm no longer using Patreon.
The code for this is now available on GitHub: https://github.com/ashleydavis/internet-speed-test
Why?
Ok so this is Australia, we aren't exactly known for our fast internet. After being frustated by poor performance and regular outages I started testing my internet speed more frequently. I did this manually for a while before I committed to coding an automated solution.
To be fair my service provider has given excellent customer service trying to resolve these issues and my internet speed has improved: it is now adequate, if not great.
However I still regularly get periods of bad performance (less than 1 Mpbs) and even outright outages (less than 100 Kbps). Charting your internet speed gives you some proof that you have a problem.
Screenshot
This screenshot shows what I'm aiming at:
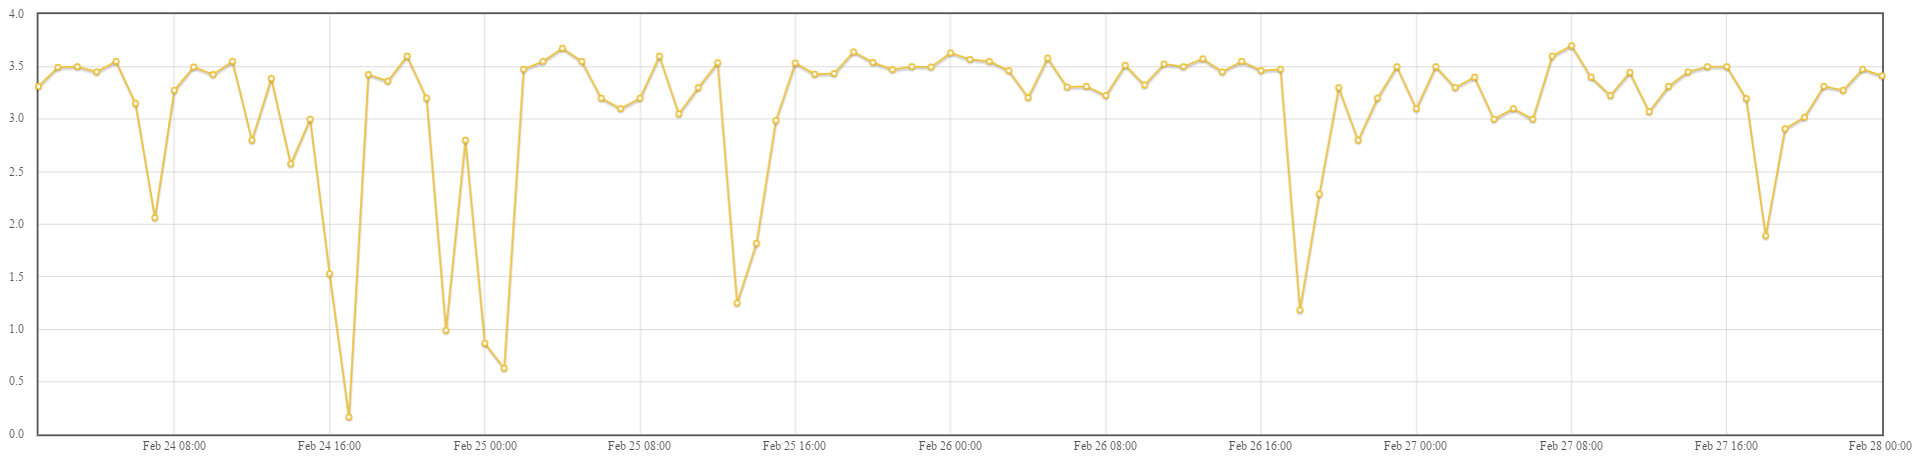
This graph that shows average internet performance over time. The X axis is time. The Y axis is Megabits per second (Mbps).
Manually measuring internet speed
The first step when automating this kind of thing is to do it manually at least once.
So I go to Fast.com and measure my current internet speed:
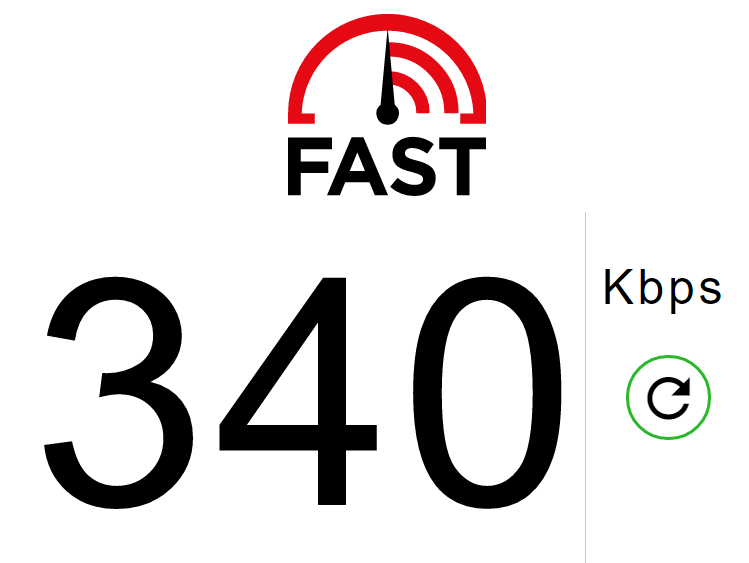
Hmm... looks like I'm experiencing rotten internet speed right at this moment!
Alhough this is far from the worst performance I have seen!
Gathering the data via JavaScript
My first hurdle is to figure out how to acutally measure my internet speed. I tried a bunch of different libraries to do this before discovering fast-cli.
Fast-cli wraps up Fast.com which is great because that's what I was using to measure my internet speed manually.
At first glance it's not too difficult to use:
const api = require('fast-cli/api');
api((err, result) => {
    if (err) {
        // Something went wrong.
        console.error(err && err.stack || err);
        return;
    }

    console.log(result);
});
I ran this code from the Node.js REPL I get the following output:
{ isDone: false, speed: 2.9, unit: 'Kbps' }
{ isDone: false, speed: 18, unit: 'Kbps' }
{ isDone: false, speed: 25, unit: 'Kbps' }
{ isDone: false, speed: 43, unit: 'Kbps' }
{ isDone: false, speed: 48, unit: 'Kbps' }
{ isDone: false, speed: 250, unit: 'Kbps' }
{ isDone: false, speed: 300, unit: 'Kbps' }
{ isDone: false, speed: 340, unit: 'Kbps' }
This stream of output keeps coming for about 10 seconds. It continues until isDone comes through as true which indicates the final reading:
{ isDone: true, speed: 230, unit: 'Kbps' }You can see that the script is retrieving multiple readings of my internet speed before it finishes.
Recording the data
I need to record the data somewhere so I choose to output to a CSV file: internet-speed-log.csv.
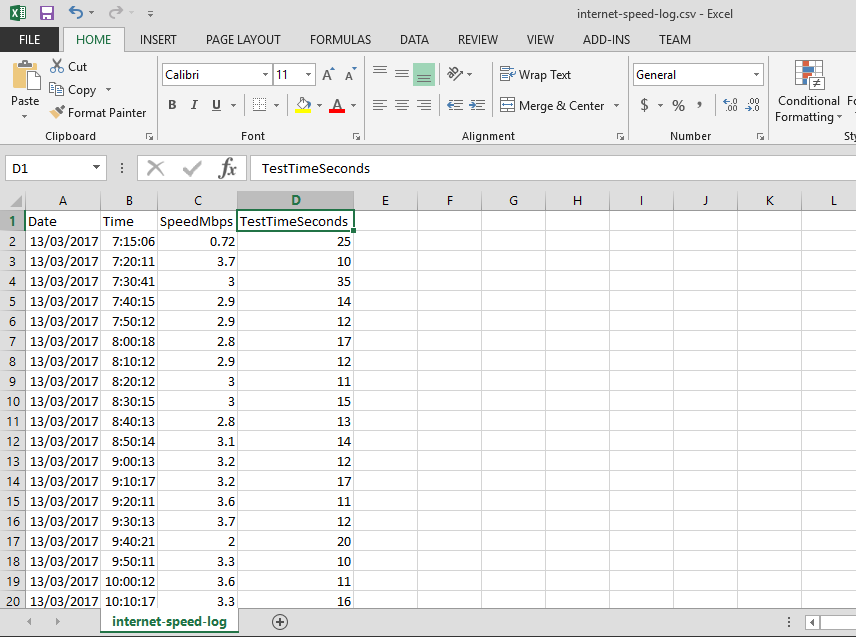
CSV is convenient because you can simply load it up in Excel to view it and make your own charts.
Just be careful you don't keep the file open in Excel while internet speed testing is running. It won't be able to append data to the file while you have it open. This is something about Excel that continues to annoy me.
If you want to reset your data you can simply delete the CSV file and the data recording will begin again.
Scheduled recording
Now the point of this whole project is to automatically record my internet speed over time. I need a way to schedule the speed test and recording of the data.
Those of you familar with Unix tools may already know of Cron. Cron is time-based task scheduler for Unix. I want to run my internet speed test every 10 minutes. So I create a Cron pattern that achieves this:
0 */10 * * * *This is much the same as the crontab definition on Wikipedia.
However I'm not using Unix. I develop and run this on my Windows box using Node.js. Fortunately I have a JavaScript equivalent for Cron that I quite like. I use it to schedule my reoccurring job:
var theRecurringJob = function () {
    // Measure and record internet speed here.
};

var CronJob = require('cron').CronJob;
new CronJob('0 */10 * * * *', theRecurringJob, null, true, 'Australia/Brisbane');
That's all that's needed to schedule a recurring task. The code that's in theRecurringJob will run every 10 minutes for eternity (or until your computer breaks down, whichever comes first).
Fixing issues with Fast-cli
I had this all up and running and was testing when I noticed a problem with fast-cli.
On an irregular basis fast-cli wasn't giving a final result where isDone was set to true. It would just abort the stream of output seemingly without finishing.
I delved into their code (hurrah for open source) and found the problem. It has this conditional logic preventing it from executing the callback when the speed has not changed. So if the speed was the same on the last test run the final result wasn't being passed on:
if (result.speed > 0 && result.speed !== prevSpeed) {
    cb(null, result);
}
This was fairly easily fixed by allowing the final result to always pass through when isDone is true:
if ((result.speed > 0 && result.speed !== prevSpeed) || result.isDone) {
    cb(null, result);
}
I would have made the change and made a pull request to the fast-cli team, however their codebase in github has changed substantially since the last npm release. They may have already fixed the problem but haven't rolled out a new release. We'll see. It might be fixed already by the time you read this article.
Exposing the data with a REST API
To visualise the data in a web page I first need to create a REST API to expose the data.
I start with a fairly standard Express server and add a request handler for HTTP GET:
app.get('/internet-speed', (req, res) => {
var data = [];
try
{
if (fs.existsSync(outputFileName)) {
data = papa.parse(fs.readFileSync(outputFileName, 'utf8'), {
header: true,
dynamicTyping: true,
}).data;
}
res.json(data);
}
catch (err) {
console.error(err && err.stack || err);
res.sendStatus(500);
}
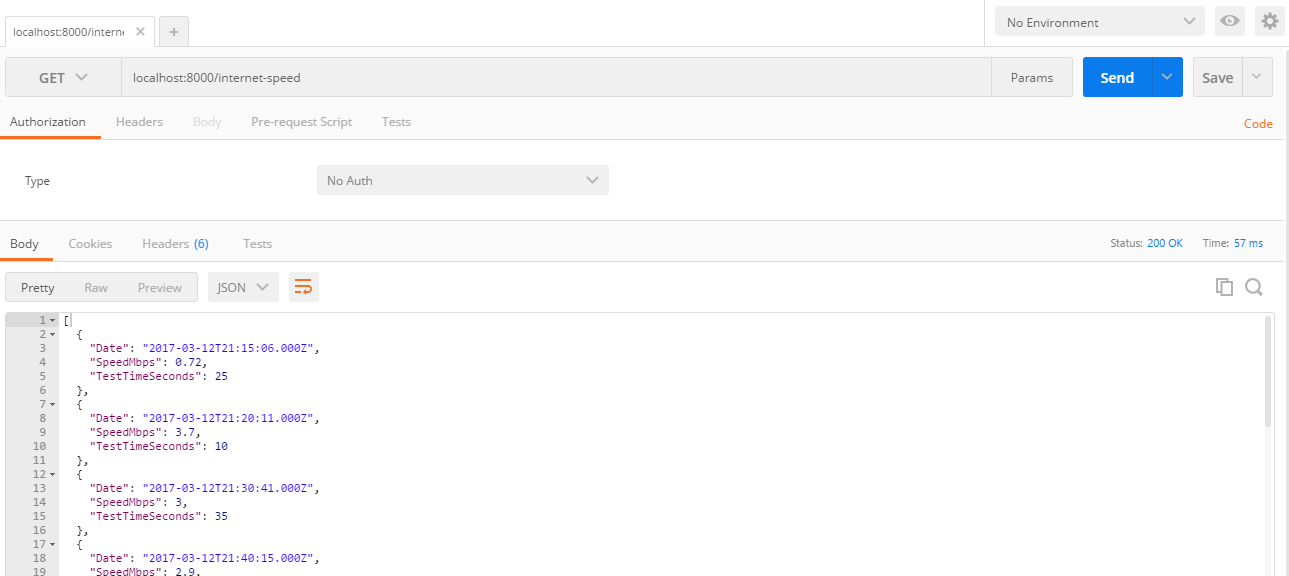
});The CSV file is deserialized with the awesome Papa Parse before being returned to the client.
Before attempting to graph the data I test it with Postman:
Graphing the data with Flot
Next I add Flot to my webpage for charting the data. It's simple and easy to setup.
To the HTML I add a placeholder element to contain the chart:
<div id="placeholder" style="width: 100%; height: 500px;"></div>In the JavaScript code for the webpage I use HTTP GET to retreive the internet speed data. I then initialize the chart and pass in the data and options:
var options = {
    lines: {
        show: true
    },
    points: {
        show: true
    },
    xaxis: {
        mode: "time",
        timezone: "browser",
    },
    grid: {
        hoverable: true,
        clickable: true
    },
};

$.get("internet-speed", function (data) {
    var series = [];
    var limit = 2;

    for (var i = 0; i < data.length; ++i) {
        var row = data[i];
        var mbps = row.SpeedMbps;
        var t = new Date(row.Date).getTime();
        series.push([t, mbps]);
    }

    $.plot("#placeholder",
        [
            {
                label: "Average Mbps",
                data: series,
            },
        ],
        options
    );
});
Final result, this is my internet speed on the day I publish this post:

Conclusion
In this post we looked at automated internet speed testing using Fast-cli and outputting the results to a CSV file and visualizing using Flot.
If you also need to test your internet speed I hope that this post helps to get you started.
Example code, support and a working build of the code will be made available to Patrons.
Resources
Fast-cli: https://www.npmjs.com/package/fast-cli
Flot: http://www.flotcharts.org/
Papa Parse: http://papaparse.com/